KPI

KPI represents graphical overview of all the mappings' records processed through HubBroker platform.
KPI report is divided into main 4 categories:
- KPI report - Successful Mappings' Records
- KPI report - Failed Mappings' Records
- KPI report - Mappings' Records Duration
- KPI report - Mapping Request Vs Mapping Delivery
KPI report - Successful Mappings' Records
This KPI report indicates the ratio of the successful mapping records vs failed mapping records.
Means, If you have 100 mapping records a month and out of 100 there are 95 successful records then this KPI indicates 95%.
You can also set the KPI target in percentage to see the final result if the KPI is successful or failed. Green color indicates that the target is achieved and the KPI is successful.
Ex. If there are 95% successful mapping records in the month which is higher then the target (90%) set in the settings, then KPI will indicate success(Green color).
KPI report - Failed Mappings' Records
This KPI report indicates the ratio of the failed mapping records vs successful mapping records.
Means, If you have 100 mapping records a month and out of 100 there are 5 failed records then this KPI indicates 5%.
You can also set the KPI target in percentage to see the final result if the KPI is successful or failed. Green color indicates that the target is achieved and the KPI is successful.
Ex. If there are 5% failed mapping records in the month which is less then the target (10%) set in the settings, then KPI will indicate success(Green color)

KPI report - Mappings' Records Duration
This KPI report indicates the ratio of the transactions received to your destination gateway within the specified time interval.
Means, If you have 100 transactions a month and out of 100 there are 95 transactions reached within the time interval(10 Minutes) set in the settings, then 95% transactions are on time.
You can also set the KPI target in percentage to see the final result if the KPI is successful or failed. Green color indicates that the target is achieved and the KPI is successful.
Ex. If there are 95% on time transactions in the month which is higher then the target (90%) set in the settings, then KPI will indicate success(Green color).

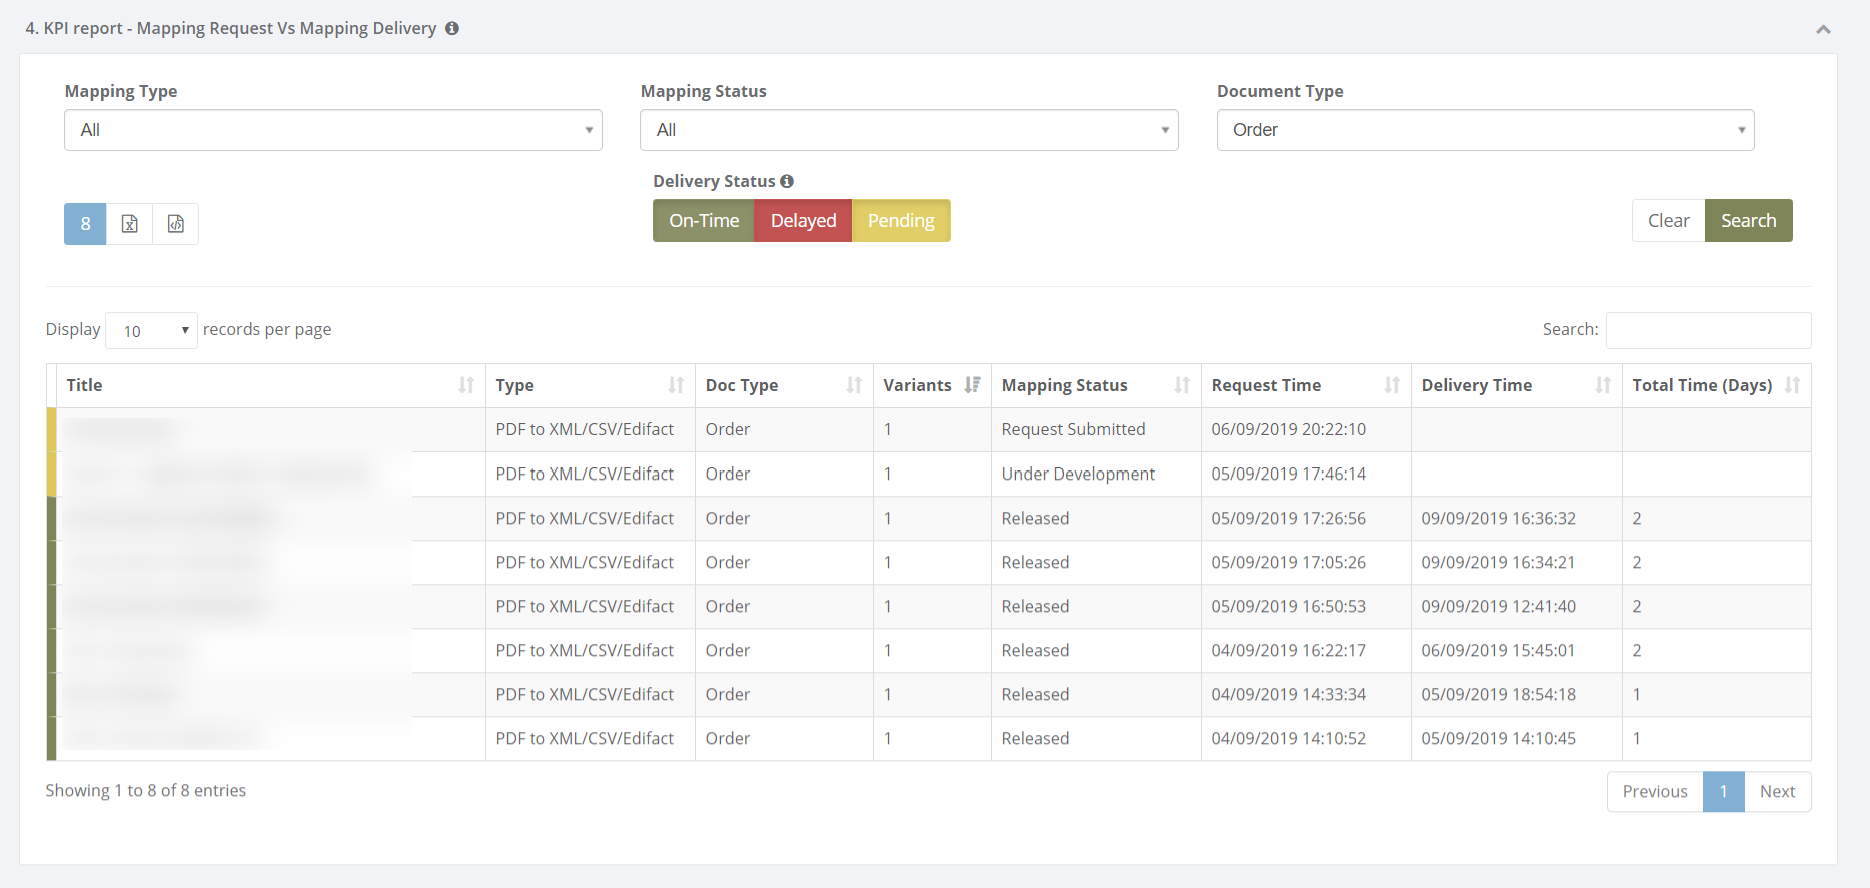
KPI report - Mapping Request Vs Mapping Delivery
This KPI report shows the time duration between the mapping request and mapping delivery time for all the mappings in your account.
You can filter the report based on the below criteria.
Mapping Type: PDF to XML, XSLT transformation etc...
Mapping Status: Released, Under configuration, Under development etc...
Document Type: Order, Invoice, Order response etc...
Delivery Status: On-Time, Delayed, Pending.
- On-Time: If the duration is less than 3 days, then it will be an On-Time delivery.
- Delayed: If the duration is greater than 3 days, then it will be Delayed delivery.
- Pending: If the mapping is in progress, the status will be pending for that mapping.

User can set settings for KPI report
Setting 1 is connected with KPI report category 1
- User can set KPI target(%) for successful mappings' records
Setting 2 is connected with KPI report category 2
- User can set KPI target(%) for failed mappings' records
Setting 3 is connected with KPI report category 3
- User can set KPI target(%) for on-time mappings' records
- User can set delivery time and delivery gateways
- Values (Delivery time and delivery gateways) are connected with Records In Out Time Duration Report
- If values in KPI reports are changed then filtration values will be changed into Records In Out Time Duration automatically
- If values in Record In Out Time Duration are changed then values will be changed into KPI report

Category: Analytics & Reports
Last date of update: 10.09.2019
